
Table of Contents
Our crypto research focuses on the quantitative analysis of Bitcoin price movements using statistical methods and historical market data.
We study Bitcoin across multiple timeframes and develop data-driven approaches to price forecasting, support and resistance analysis, and the evaluation of technical market indicators. Our objective is to replace subjective chart interpretation with transparent, statistically testable methods based on historical Bitcoin price data.
The crypto research presented on this website is based primarily on Bitcoin market data obtained from cryptocurrency exchanges and covers different periods and timeframes. Where applicable, our research methods have been described and evaluated in peer-reviewed academic publications.
Bitcoin’s Weekly Closing Price Forecasting Model
This research presents a methodological approach to forecasting Bitcoin’s weekly closing price using a correlation-indicator model. The study examines the relationships between the MACD indicator, historical Bitcoin price data, and Pearson correlation coefficients to identify the parameters and combinations of parameters that have the greatest impact on forecast accuracy.
The model was developed and tested using Bitcoin weekly closing-price data covering 346 weeks from April 2, 2018, to November 11, 2024. It produces three types of forecasts: the weekly Bitcoin closing price, the price increase following the first price drop event, and the price decrease following the first price increase event.
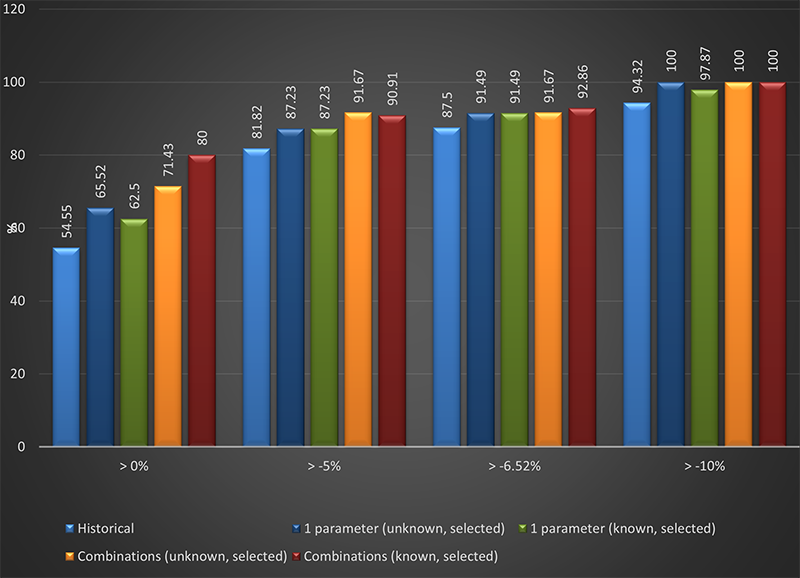
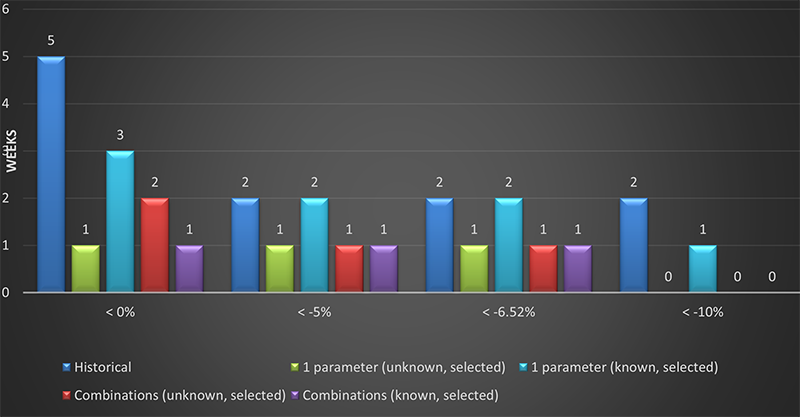
The results indicate that the developed model can achieve a higher probability of successful forecasts (Picture 1) than observed historical price movements, while unsuccessful forecast sequences are significantly shorter (Picture 2) than corresponding sequences of opposite price movements in the historical data. In some tests, the model achieved a 100% probability with zero failed forecasts.
The study demonstrates the potential of a correlation-indicator approach for quantitative Bitcoin price forecasting under conditions where future market data are unknown.
DOI: 10.55643/fcaptp.5.64.2025.4884
ResearchGate: link
Bitcoin Support and Resistance Levels
This research presents a statistical approach to identifying Bitcoin support and resistance levels without relying on manually drawn chart patterns or subjective technical analysis.
The methodology calculates percentage deviations from previous closing prices and evaluates how frequently Bitcoin’s subsequent closing price remains above or below each projected level. The analysis covers multiple timeframes, including monthly, weekly, daily, hourly, and 15-minute intervals.
The resulting levels are derived from historical Bitcoin price data and can be used as statistical reference points for market analysis and risk management.
Bitcoin MACD Analysis
This research section provides historical Bitcoin weekly price data together with corresponding MACD (Moving Average Convergence Divergence) histogram values and examines the relationship between the MACD histogram and different measures of Bitcoin price dynamics.
The underlying dataset is based on Bitcoin spot prices obtained from Binance, with MACD histogram values calculated from historical price data. The data provide a basis for quantitative analysis of Bitcoin market behavior, MACD dynamics, and the persistence of price movements.
The research includes three studies examining the relationship between changes in the MACD histogram and Bitcoin’s weekly maximum price, minimum price, and closing price. The studies analyze whether changes in the MACD histogram are followed by corresponding changes in Bitcoin prices and examine the duration of consecutive price and MACD movements.
The findings provide statistical insights into the potential relationship between MACD dynamics and Bitcoin price movements across different price measures. In particular, the studies examine the continuation and potential termination of medium-term price movements and identify historical probabilities associated with specific MACD and price patterns.
These studies are intended to provide a quantitative basis for further research into Bitcoin price behavior and the potential use of the MACD histogram in forecasting. The MACD histogram is not considered a standalone forecasting tool, and the findings should be interpreted in the context of historical data and other market factors.